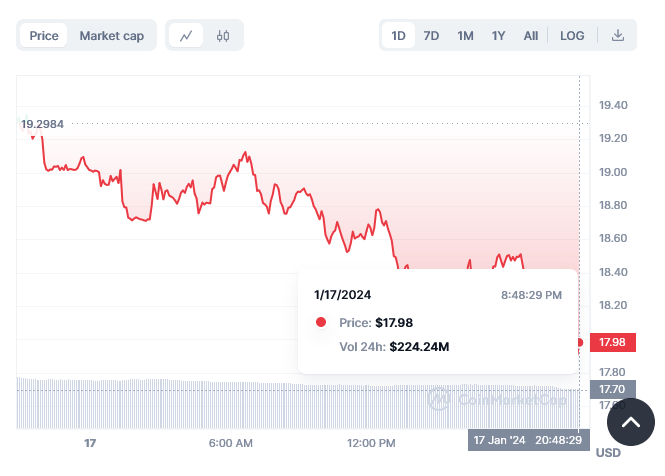
In the last 24 hours, the price of Celestia’s TIA/USD has experienced a notable decline, dropping by 5.74% to reach $18.27. This downturn stands in contrast to the positive trend observed in the preceding week, during which the cryptocurrency recorded an impressive 28.0% gain, surging from $14.3 to its present value.
Celestia price chart reveals distinct patterns when comparing the 24-hour period to the past week. The accompanying chart portrays this juxtaposition, with the left side reflecting the daily fluctuations and the right side illustrating the weekly trends. The inclusion of Bollinger Bands, represented by gray bands, aids in measuring volatility. Notably, wider bands or a larger gray area signify heightened volatility during specific timeframes.

Meanwhile, trading volume for Celestia has experienced a significant decline of 42.0% over the past week. In contrast, the circulating supply of the coin has seen an uptick, rising by 8.27%. This results in the current circulating supply reaching 158.14 million. According to our data, Celestia’s TIA holds the #33 market cap ranking, with an estimated market cap of $2.89 billion.
The market dynamics suggest a period of increased volatility, as evidenced by the fluctuating Bollinger Bands. Investors and traders may find the recent drop in trading volume coupled with an augmented circulating supply noteworthy, as these factors could influence the coin’s overall market performance.
As Celestia navigates these fluctuations, market participants will likely closely monitor the interplay between price movements, trading volume, and circulating supply, seeking valuable insights to inform their investment decisions in this dynamic cryptocurrency landscape.